
Our interns gain valuable artistic and collaboration experience by having the chance to put their skills to work on real projects.

5/11/21 1:04 PM
illustration, collaboration, education, hiring, interns, process, sketch, thinking, work, employee experience, information design, learning

A good infographic is an accurate, consumable, attractive visual overview of a complex topic. Here's where they can go wrong, or do right.
4/1/21 11:41 AM
infodesign, Infographics, process, visual thinking, clients, content, infographic, information design, visual storytelling, visualization, magic
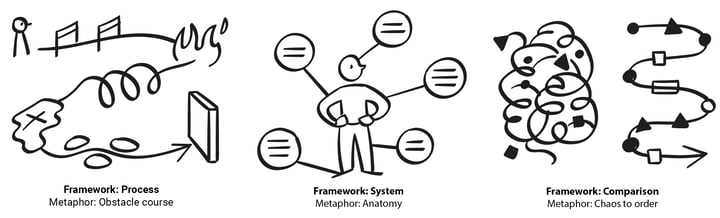
Visual frameworks are the backbone of nearly every infographic you’ve ever seen, or ever will see. Almost every visual story can be built around (or retroactively reduced to) being a Process, a System, or a Comparison.
2/10/21 11:28 AM
frameworks, infodesign, process, system, visual thinking, brainstorming, comparison, information design, visual storytelling
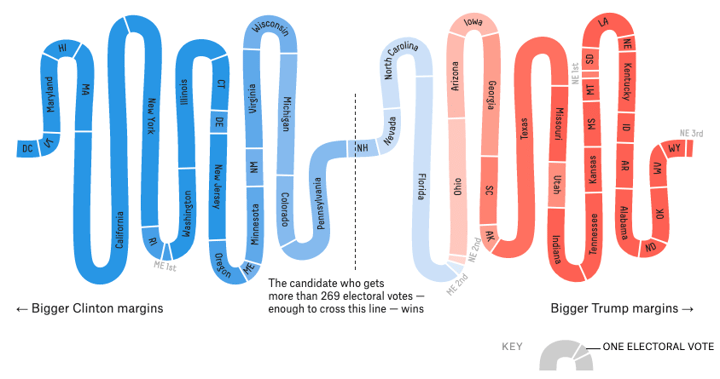
What is the best way to represent election returns? We've got simple vote tallies, colored maps, pie and bar charts, and other data visualizations... but just like our democracy, none are perfect.
10/27/20 7:57 AM
Infographics, communication, visual thinking, data, information design, Data visualization, visualization, vote

Facilitated, real-time virtual collaboration gives structure and direction to important remote meetings. Guided exercises help teams discover and align. Live sketching brings your ideas to life.
5/15/20 10:25 AM
Infographics, meeting, collaboration, visual thinking, information design, Live sketching, visual storytelling, visualization, remote, virtual collaboration, covidchronicles
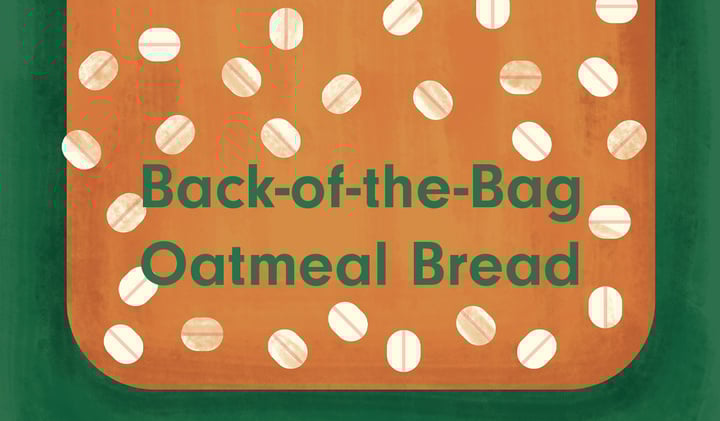
Perhaps you’ve noticed that everyone on your social media has started baking bread from scratch. There's a really good—and simple—reason for this: deliciousness.
5/13/20 7:41 AM
infodesign, recipe, infographic, information design, visualization, covidchronicles, food

Let's calm down for a minute. Or seven. Or 15. Or whatever you're willing and able to allocate to doing a little yoga or meditation. Here's a simple sequence to get you started.
4/21/20 1:40 PM
health, wellness, infographic, information design, happiness, yoga, covidchronicles

The term 'information design' sounds academic, but it's really egalitarian. Its entire purpose is to explain something so people can take informed action.
2/7/20 8:26 AM
infodesign, Infographics, Animation & video, magazine, charts, information design, Data visualization, newspaper

Last week we looked at some of the many things we do or need to think about during the Production phase of a visual storytelling project. Let's jump back in...
10/21/19 8:12 AM
illustration, animation, process, video, information design, production, Interactive

When I was in college, I was tasked with drawing a dog as part of an assignment. Every day, I would bring a slightly different dog drawing to class—and every day, my professor would frown at my work and tell me I needed to redo it.
8/26/19 8:25 AM


