
A good infographic is an accurate, consumable, attractive visual overview of a complex topic. Here's where they can go wrong, or do right.

4/1/21 11:41 AM
infodesign, Infographics, process, visual thinking, clients, content, infographic, information design, visual storytelling, visualization, magic
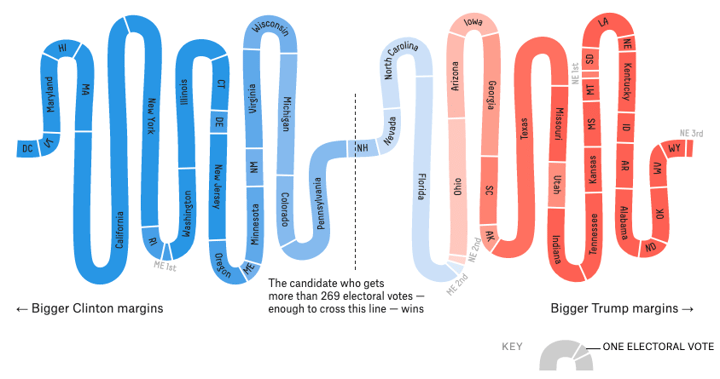
What is the best way to represent election returns? We've got simple vote tallies, colored maps, pie and bar charts, and other data visualizations... but just like our democracy, none are perfect.
10/27/20 7:57 AM
Infographics, communication, visual thinking, data, information design, Data visualization, visualization, vote
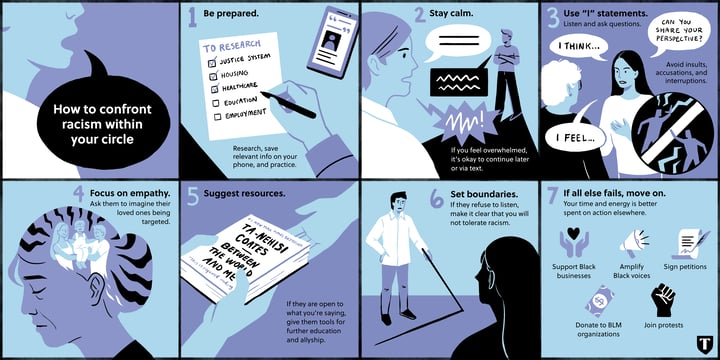
Hard times aren’t helped by empty gestures, so we’re offering some clear and direct tips to help non-Black people confront and discuss racism and what’s been going on.
6/16/20 4:21 PM
Infographics, understanding, Books, communication, visual thinking, empathy, learning, visual storytelling, racism, infobits

Facilitated, real-time virtual collaboration gives structure and direction to important remote meetings. Guided exercises help teams discover and align. Live sketching brings your ideas to life.
5/15/20 10:25 AM
Infographics, meeting, collaboration, visual thinking, information design, Live sketching, visual storytelling, visualization, remote, virtual collaboration, covidchronicles

The term 'information design' sounds academic, but it's really egalitarian. Its entire purpose is to explain something so people can take informed action.
2/7/20 8:26 AM
infodesign, Infographics, Animation & video, magazine, charts, information design, Data visualization, newspaper

We've been working with a fast-moving company called Niche. They provide development, implementation, and support for system architectures that better enable law enforcement agencies to serve their communities.
10/30/19 12:12 PM

Your data has a story to tell. Sometimes, it’s known or obvious. But other times, as you begin to dig into it, you find an entirely new or unexpected story. Here’s how to make the most of it using visual storytelling.
8/14/19 1:51 PM
illustration, Infographics, storytelling, visual thinking, data, information design, presentation, Data visualization, visual storytelling, visualization

Some infographic projects go so smoothly you wonder if you missed something. Some are more of a challenge.
8/13/19 8:35 AM
Infographics, napkin, blueprint, process, tremendousness, visual thinking, clients, information design, visualization

Lots of us—whether businesspeople, teachers, innovators, or even parents—rely heavily on our words to explain important, complex things. But words alone aren’t enough.
7/18/19 3:43 PM
Infographics, communication, editorial, visuals, Presentations, visual storytelling, visualization, ROI, words

Learn how infographics are valuable in healthcare and can help teach, communicate, and (sometimes) even overcome language barriers.
6/18/19 10:12 AM
health, Infographics, wellness, business, research, information design, science, healthcare, medical


